The cost of a mis-hire: a working model for engineering teams under 50
A wrong senior hire on a twelve-person team costs a median of $214,000 once you count everything. Salary is a minor line in that number, and the largest one is almost never measured.
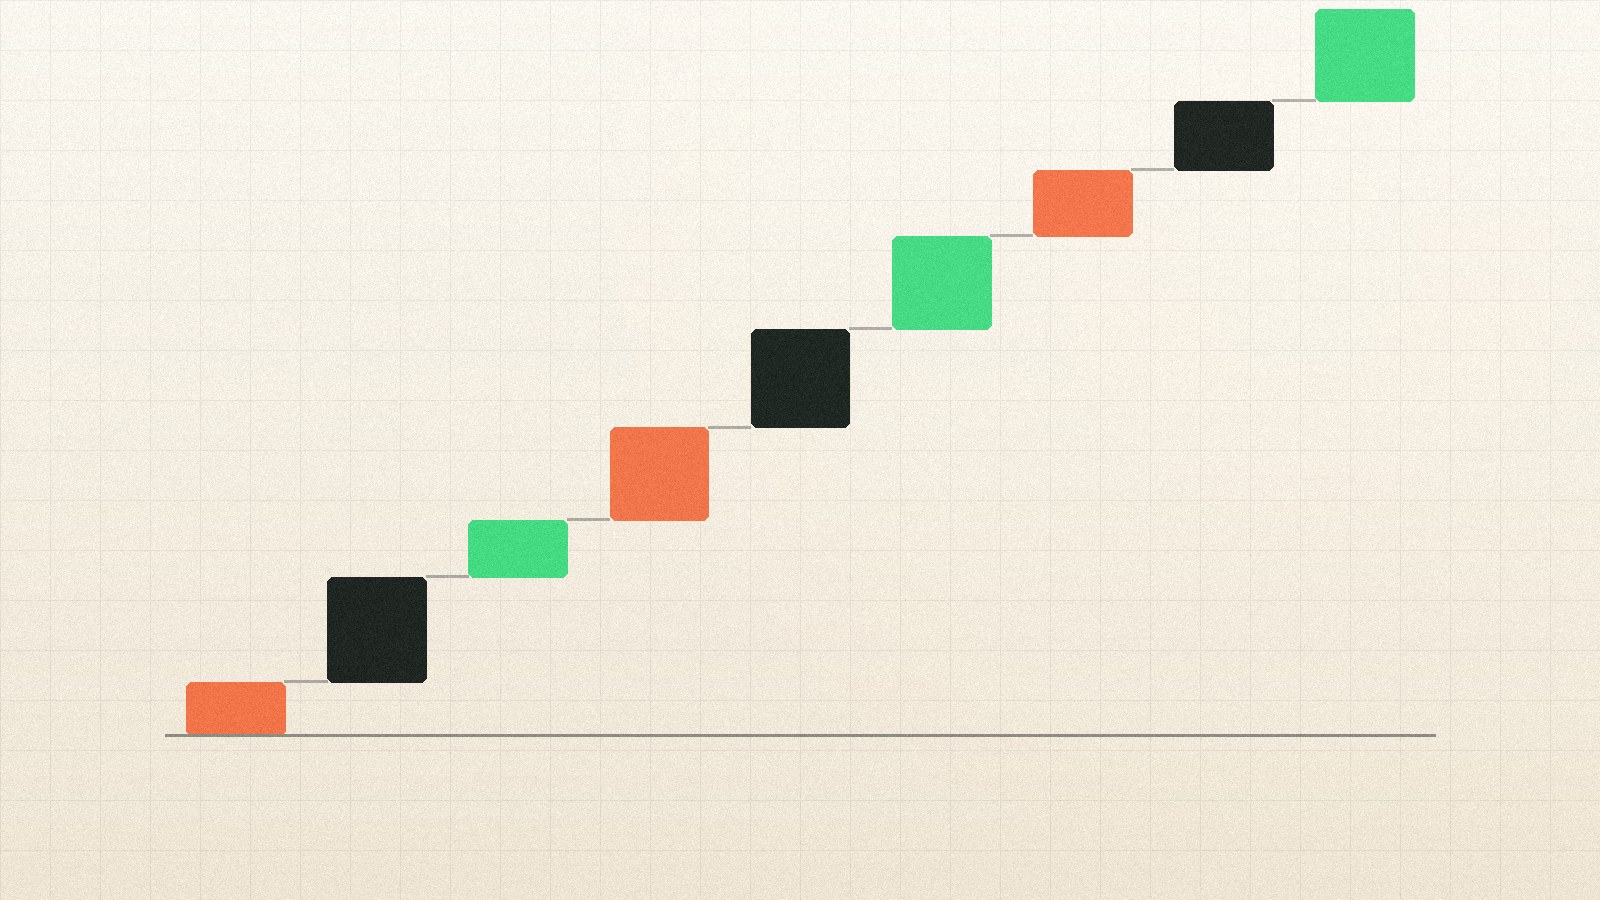
Cumulative cost of a mis-hired senior engineer on a twelve-person team, by component. Each block adds to the running total; salary is the first block only.
What the data shows
- Median all-in cost of a mis-hired senior engineer on a team of twelve: $214,000. Direct salary paid accounts for 29% of it.
- The largest single component is team drag, the productivity lost by the other engineers to rework, unblocking and management overhead. It accounted for a median of $61,000 and is almost never tracked.
- The median time to recognise a mis-hire was 5.2 months; the median time to act on it was a further 3.8 months. That nine-month gap is where most of the cost accumulates.
- Small teams carry disproportionate risk: on a team of eight, a single mis-hire consumed 14% of total engineering capacity for two quarters.
- Companies with a structured 90-day check-in recognised mis-hires 2.1 months earlier and cut total cost by roughly a third, at essentially no cost to implement.
Most companies can tell you what a hire costs. Almost none can tell you what a wrong hire costs, which is why hiring budgets are argued about in terms of recruiter fees and almost never in terms of the thing the fees exist to prevent.
We built this model from 71 documented mis-hire cases at companies with between five and fifty engineers, where the hiring manager agreed to a structured retrospective at resolution. It is a working model built on a small sample, not a law of nature, and we have published the assumptions so you can disagree with them.
Salary is the small part
The median all-in cost was $214,000, against a fully-loaded senior salary of $140,000. Nine months of salary ($62,000) accounts for 29% of the total. Recruiting and re-hiring together add another $22,000, which is the figure most companies actually budget for.
The rest, roughly $130,000, is the part that never appears on a line item. The largest component is team drag: the time other engineers spent unblocking, correcting, re-explaining and quietly redoing. At a median of $61,000 it is nearly as large as the salary itself, and almost no organisation in our sample was measuring it.
Rework adds $23,000, management time $16,000, and the opportunity cost of the work that simply did not happen another $21,000. This last figure is the softest number in the model and we would treat it as indicative rather than precise.
Where the money actually goes
Cost components for a median mis-hired senior engineer on a twelve-person team, in US dollars.
The gap between knowing and acting
Figure 2 contains the most actionable finding here. The median manager recognised the problem at 5.2 months. The median resolution happened at 9.0 months. That 3.8-month gap is not indecision about the facts; it is the time it takes to work up to a difficult conversation, exhaust the improvement plan, and get sign-off.
Cost accrues fastest in exactly that window, because by then the engineer is embedded in the work and the drag on colleagues is at its peak. A month of delay at month seven costs roughly twice what a month of delay at month two costs.
Companies running a structured 90-day review (a written check against the expectations set at hire, not a casual catch-up) recognised problems 2.1 months earlier and ended at a median total cost of $147,000 rather than $214,000. This is a saving of roughly a third for an intervention that costs an hour of a manager's time per hire.
The nine months before anyone acts
Cumulative cost by month since start date, split by whether the company ran a structured 90-day review.
A month of delay at month seven costs roughly twice what a month of delay at month two costs.
Section 2: The gap between knowing and acting
Why small teams should care most
Figure 3 shows the capacity effect by team size and it is sharply non-linear. On a team of five, a single mis-hire consumed 19% of engineering capacity over two quarters. On a team of fifty, 2.5%.
A large organisation can absorb a bad hire; the work gets redistributed and the quarter still lands. A twelve-person team cannot. The same absolute mistake becomes an existential one somewhere around the point where the team is small enough that everyone's work touches everyone else's.
This is the argument for small teams being more rigorous about hiring than large ones, which is the reverse of what usually happens. Small teams hire faster and looser because they are under more pressure and have less process. The economics say they are the ones who can least afford it.
Smaller teams carry more risk per hire
Share of total engineering capacity consumed by a single mis-hire over two quarters, by team size.
What this implies about vetting spend
If a mis-hire costs $214,000 and a structured process reduces mis-hire rate by even a few points, the arithmetic on assessment spend is not close. At a 12% baseline mis-hire rate, roughly what we observe for unstructured processes, reducing that to 7% is worth about $10,700 per hire in expected value.
We have an obvious commercial interest in this conclusion, so treat it accordingly and run the numbers with your own baseline. The model, including the assumptions we are least confident about, is in the methodology below.
| Component | Median | Range (P25-P75) | Tracked by most companies? |
|---|---|---|---|
| Salary paid to resolution | $62,000 | $41k - $88k | Yes |
| Team drag | $61,000 | $28k - $104k | No |
| Rework of shipped code | $23,000 | $9k - $47k | Rarely |
| Opportunity cost | $21,000 | $6k - $58k | No |
| Management time | $16,000 | $9k - $27k | Rarely |
| Recruiting cost | $14,000 | $7k - $31k | Yes |
| Onboarding | $9,000 | $5k - $16k | Sometimes |
| Re-hire cost | $8,000 | $4k - $19k | Yes |
Table 1: Cost components with dispersion. Normalised to a twelve-person team and a $140k fully-loaded senior salary.
Methodology and limitations
Sample: 71 mis-hire cases at 58 companies with 5-50 engineers, documented between September 2025 and April 2026 through a structured retrospective completed by the hiring manager at resolution. A mis-hire is defined as a hire that ended in departure, role change or formal performance management within nine months, where the manager attributed the outcome to a hiring error rather than to circumstance.
- Normalisation. All figures are scaled to a twelve-person team and a $140,000 fully-loaded senior salary so cases can be compared. Your own numbers should be scaled from your actual loaded cost.
- Team drag. Estimated from colleagues' time attribution where available (n = 34) and from manager estimate where not (n = 37). Manager-estimated cases ran about 12% higher and we report the pooled median.
- Opportunity cost. The weakest number in the model. Estimated by the hiring manager at resolution and highly sensitive to how they framed the counterfactual. Treat the P25-P75 range as more informative than the median.
- Selection. Managers who agree to a mis-hire retrospective are unlikely to be a random sample. Cases that ended amicably and quietly are probably under-represented, which would bias our medians upward. With 71 cases, the percentile ranges in Table 1 are wide for a reason.
- Conflict of interest. Engagetal sells vetting. The final section of this report argues that vetting is economically justified. Read that section with the appropriate scepticism and check it against your own baseline mis-hire rate.
Want the underlying data?
We share anonymised datasets and full statistical appendices with researchers, journalists and customers on request. Write to us and tell us what you are trying to work out.
Related reports

Where the talent is
Nine thousand assessments across 38 countries in our first three quarters. Regional pass rates sit within seven points of each other, which makes country a poor filter.
Read the report
The async advantage
Delivery velocity peaks at three to four hours of daily overlap and falls after that. Writing things down is worth about four hours of timezone alignment.
Read the report
What vetting actually predicts
We checked our own vetting against what happened next for 412 placed engineers. Written reasoning predicted performance well. Timed algorithm puzzles predicted nothing, so we removed them.
Read the report