The async advantage: timezone overlap and delivery velocity
We measured delivery outcomes for 168 distributed engineering teams against their actual hours of overlap. More overlap helped, up to a point. Past four hours it started to hurt.
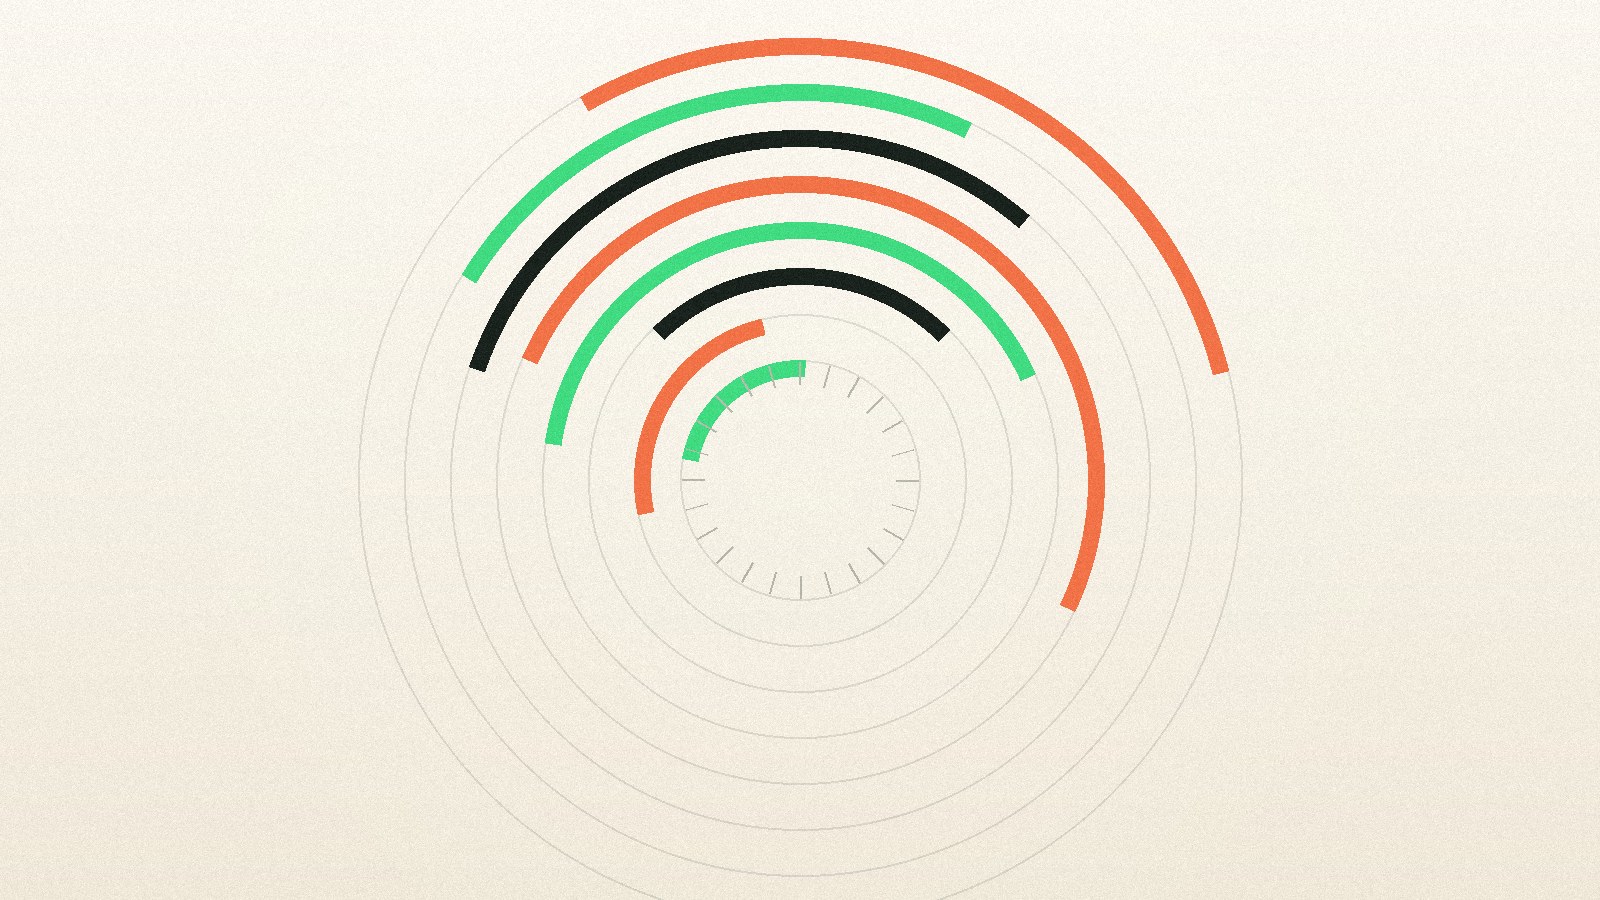
Delivery velocity against daily timezone overlap for 168 distributed teams. The arcs represent overlap windows; the highlighted band marks the range where measured velocity peaks.
What the data shows
- Delivery velocity peaked at 3-4 hours of daily overlap, not at maximum overlap. Teams with 7+ hours of overlap delivered 11% less than teams with four.
- Written-first teams outperformed at every overlap level. The gap was widest at low overlap, where written-first teams with 2 hours matched synchronous teams with 6.
- Meeting load rose almost linearly with available overlap. Teams with 7+ hours spent 31% of the week in meetings against 14% for teams with 3-4 hours.
- Zero-overlap teams did badly, 24% below the peak, but the failure mode was decision latency, not communication volume. Median time to resolve a blocking question was 19 hours.
- The strongest single practice was a written decision log. Teams that kept one were 17% faster regardless of overlap, and it was the only practice that helped every configuration.
"How much overlap do you need?" is the most common operational question we get from companies hiring internationally, and the received answer, as much as possible, turns out to be wrong.
We measured delivery outcomes for 168 distributed engineering teams over at least one full quarter each, against their actual observed overlap rather than their nominal working hours.
The curve bends
Figure 1 shows indexed velocity against overlap. It rises steeply from zero, peaks at 3-4 hours, and then declines. Teams with 7 or more hours of overlap delivered 11% less than teams with four, and only slightly better than teams with 1-2.
Zero-overlap teams did genuinely badly, at 79 against a mean of 100. So the intuition that some overlap matters is correct. The intuition that more is monotonically better is not.
Velocity against overlap is an inverted U
Indexed delivery velocity by hours of daily working-time overlap between the most distant team members.
Why more overlap makes things worse
Figure 3 explains most of the decline. Scheduled synchronous time rises almost linearly with available overlap: 14% of the week for teams with 3-4 hours, 31% for teams with 7 or more.
Meetings expand to fill the overlap available. When everyone is awake together for seven hours, the standing sync, the design review and the "quick chat" all become possible, and each of them individually looks worth an hour. The engineering week is finite, and past a certain point every additional hour of overlap gets converted into an hour of talking rather than an hour of building.
The four-hour range appears to be the point where a team has enough shared time for the conversations that genuinely need to be synchronous (a hard design disagreement, an incident, a difficult piece of feedback) and not so much that everything else drifts into a meeting by default.
Writing things down beats being awake at the same time
Indexed velocity by overlap, split by whether the team defaults to written or synchronous communication.
Writing things down is worth roughly four hours of timezone alignment.
Section 3: Written-first teams win at every level
Written-first teams win at every level
Figure 2 is the practical finding. We classified teams by whether they default to written or synchronous communication, using a practice audit covering decision logs, RFC processes and async review norms.
Written-first teams outperformed at every overlap band. The gap was widest at the bottom: a written-first team with 2 hours of overlap performed about as well as a synchronous-default team with 6. Writing things down is worth roughly four hours of timezone alignment.
This reframes the hiring question. A company insisting on six hours of overlap is, in effect, paying a large premium in reduced candidate pool to compensate for a documentation practice it could build instead. Given the supply picture in ER-2026-06, where the fastest-growing talent regions are precisely the ones that fail a six-hour overlap filter against North America, that is an expensive trade.
Available overlap gets spent on meetings
Share of the working week in scheduled synchronous time, by available overlap.
What actually fails at zero overlap
Zero-overlap teams did badly, and it is worth being precise about how. It was not communication volume; those teams wrote more than anyone. It was decision latency.
Median time to resolve a blocking question was 19 hours for zero-overlap teams against 3 hours at four hours of overlap. A question asked at the end of one day gets answered at the end of the next, and if the answer prompts a follow-up, that is another cycle. Two rounds of clarification cost two days.
The teams that handled zero overlap well had explicitly delegated decision authority. A named person who could resolve a class of question without waiting, rather than better documentation. Documentation reduces the number of questions. Only delegated authority reduces the cost of the ones that remain.
The one practice that helped everyone
Across every configuration, the single strongest practice was maintaining a written decision log: a running record of what was decided, by whom, and what was ruled out. Teams that kept one were 17% faster, and it was the only practice in our audit that helped at every overlap level.
Our read is that it works because it removes the most expensive kind of async question, the archaeological one. "Why is it built this way?" is the question that costs two days to answer and is almost always answerable from a document nobody wrote.
Methodology and limitations
Sample: 168 distributed engineering teams at 79 companies, each observed for at least one full quarter between September 2025 and January 2026. A team qualifies as distributed where at least two members are in time zones more than three hours apart.
- Overlap measure. Observed rather than nominal, computed from actual commit, message and calendar activity timestamps, taking the daily intersection of the most distant pair of team members. Nominal working hours proved close to meaningless.
- Velocity composite. Cycle time (40%), throughput weighted by reviewed complexity (40%) and reverted-change rate (20%), indexed so the sample mean is 100 and normalised within team size band.
- Written-first classification. A practice audit scoring decision logs, RFC process, meeting-notes discipline and async review norms. Teams above the sample median are classed as written-first. This is a coarse binary applied to a continuum.
- Limitations. Observational, and a single quarter of observation per team. Teams choose their own overlap and their own practices, and both correlate with company maturity, funding and management quality in ways we control for only partially. The inverted-U shape is robust to the controls we could apply, but we would want a genuine experiment, over a longer window, before treating four hours as a target rather than an observation.
Want the underlying data?
We share anonymised datasets and full statistical appendices with researchers, journalists and customers on request. Write to us and tell us what you are trying to work out.
Related reports

Contract or full-time
Contractors do not leave sooner than employees once you stop counting finished projects as attrition. They leave for reasons that are much easier to fix.
Read the report
What vetting actually predicts
We checked our own vetting against what happened next for 412 placed engineers. Written reasoning predicted performance well. Timed algorithm puzzles predicted nothing, so we removed them.
Read the report
The cost of a mis-hire
A wrong senior hire on a twelve-person team costs a median of $214,000. Salary is a minor line in that, and the biggest component is almost never measured.
Read the report