What vetting actually predicts: assessment scores against on-the-job performance
We followed 412 engineers from assessment through to their six-month review. Some parts of our own vetting predicted performance well. One part predicted nothing at all, and we have removed it.
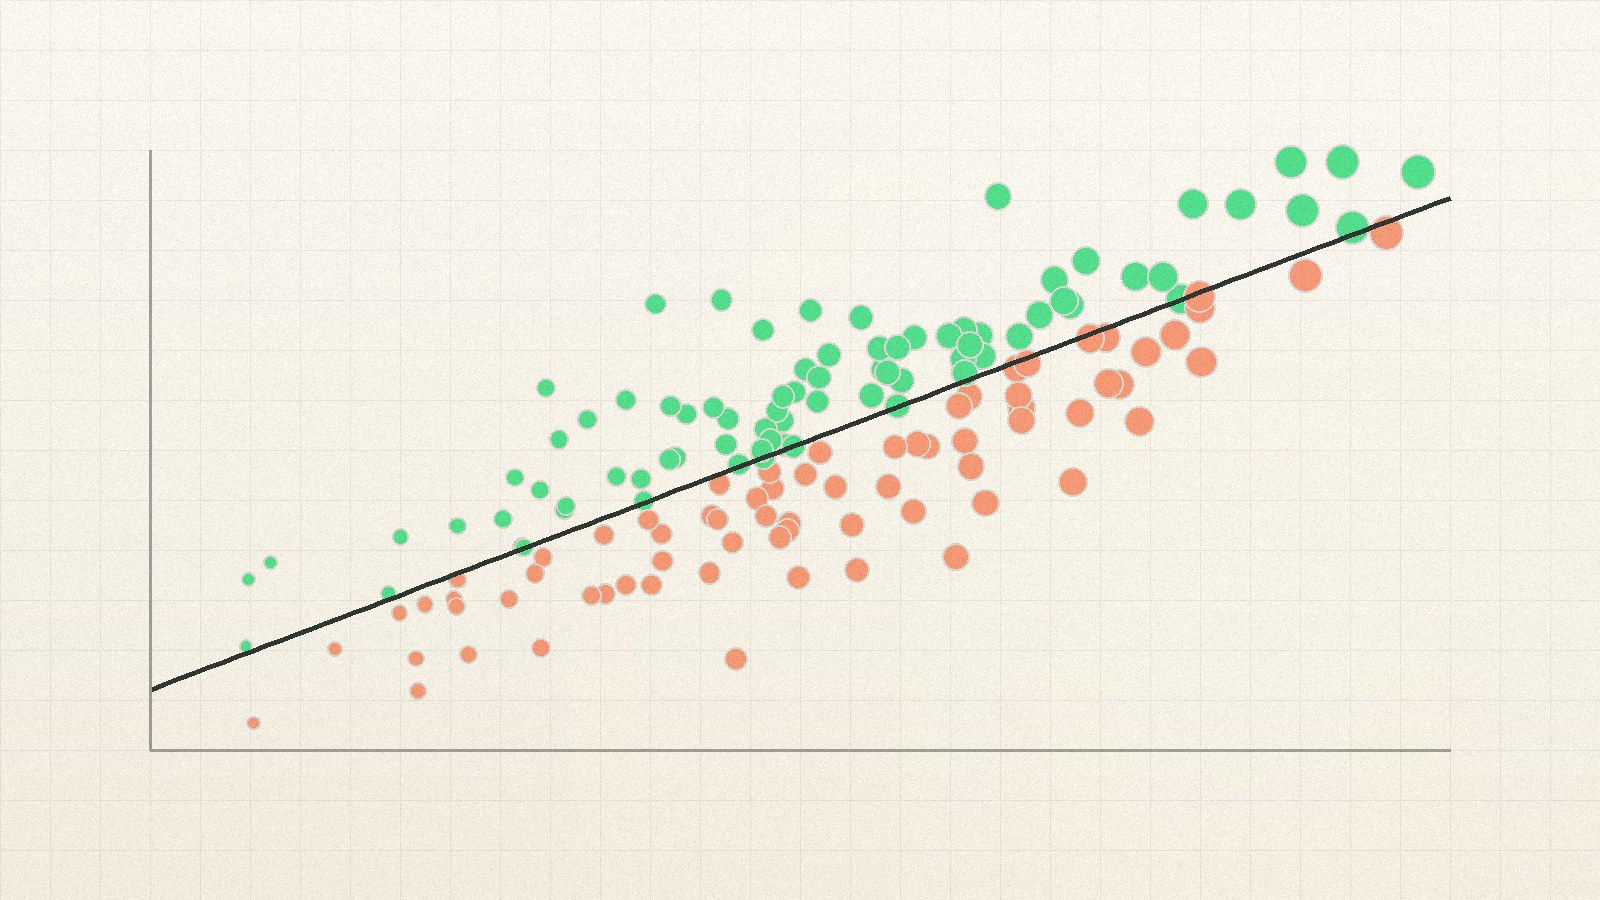
Composite vetting score against six-month manager-rated performance for 412 placed engineers. Each point is one engineer; the dashed line is the fitted regression.
What the data shows
- The composite vetting score correlated with six-month performance at r = 0.61, strong for a pre-hire signal, but far from deterministic. Roughly 63% of outcome variance remains unexplained by anything we measure before hire.
- Communication and written reasoning were the strongest single predictors (r = 0.54), ahead of algorithmic problem-solving (r = 0.31) and years of experience (r = 0.19).
- Timed algorithmic puzzles predicted almost nothing beyond what other components already captured (partial r = 0.04). We removed them from the assessment in March 2026.
- Candidates who scored in the 70-79 band outperformed their score more often than any other group, a third of them were rated in the top quartile at six months, suggesting our bar is mis-calibrated at the margin rather than too high.
- Prestige signals (university, previous employer brand, referral source) added no predictive power once work-sample evidence was in the model.
An assessment is a claim about the future. Ours says: this engineer will do good work on a team they have not met, in a codebase they have not seen. That is a bold claim to make on the strength of a few hours of evidence, and it deserves to be checked against what actually happened.
This report is that check. We took every engineer placed through Engagetal since we started operating in August 2025 who had reached a six-month review by April 2026, 412 people, and compared their assessment scores against how they were actually rated by the people they worked for.
The headline is honest but not flattering
The composite vetting score correlates with six-month performance at r = 0.61. In the context of personnel selection that is a strong result; published meta-analyses put structured interviews around 0.42 and unstructured interviews closer to 0.20. We are doing better than the industry default.
We are also explaining about 37% of the variance in outcomes, which means 63% of what determines whether an engineer succeeds is something we cannot see before they start. Team fit, manager quality, the state of the codebase, what is happening in someone's life that year. None of this is in our data, and all of it matters. Anyone selling a hiring signal that claims to be more decisive than this is either measuring something narrower or not checking.
Which parts of the assessment carry signal
Correlation with six-month manager-rated performance, by assessment component. Partial correlation controls for all other components.
Writing predicts more than puzzles
Figure 1 breaks the composite into its parts. The strongest single predictor was written reasoning. A component where candidates are given an ambiguous technical problem and asked to write a short design memo explaining their approach and its trade-offs. It correlated at r = 0.54 raw and held at 0.33 when every other component was controlled for.
System design and the work sample followed. Timed algorithmic puzzles came second-to-last raw, and collapsed to a partial correlation of 0.04 once the other components were in the model. In plain terms: the algorithm score told us almost nothing that the design memo and the work sample had not already told us.
This is not a novel finding. It echoes what a lot of engineering leaders have argued from experience for a decade, but we had been running the puzzles anyway, on the reasonable-sounding grounds that they were cheap and standardised. Cheap and standardised is not the same as informative. We removed timed algorithmic puzzles from the assessment in March 2026. Candidates get 45 minutes of their life back and our predictive power is unchanged.
Score band against outcome quartile
Where engineers in each vetting band ended up at their six-month review. The 70-79 band is the interesting one.
Sixty-three percent of what determines whether an engineer succeeds is something we cannot see before they start.
Section 1: The headline is honest but not flattering
Where our bar is wrong
Figure 2 is the chart that changed how we think about the threshold. Engineers scoring 70-79, the band immediately below our launch bar of 80, landed in the top performance quartile 33% of the time. That is not far off the 41% we see from the 80-89 band, and it is dramatically better than the 9% from 60-69.
There is a sharp discontinuity in outcomes between the 60s and the 70s, and a much softer one between the 70s and the 80s. Our bar was sitting in the soft part. We were rejecting a group of engineers a third of whom would have been top-quartile performers, and we were doing it for a gain in precision that the data does not really support.
We now admit into the pool at 72 with a flag for additional reference checking between 72 and 79, rather than a hard cut at 80. We will report on whether that was the right call in next year's edition, including if it turns out badly.
The composite score against actual performance
Each point is one placed engineer. Green points beat the line; orange points fell short of it.
Prestige adds nothing
We tested university tier, previous employer brand, and referral source as additional predictors on top of the work-sample evidence. All three added no meaningful power, the model's adjusted R² moved by less than 0.01 in every case.
They do correlate with performance on their own, which is why people believe in them. But that correlation runs almost entirely through the work-sample evidence: engineers from well-known companies tend to write better design memos, and once you have read the memo, knowing where they worked adds nothing. We do not collect employer prestige as a scored input, and this is the evidence for why.
| Assessment component | Raw r | Partial r | Weight in composite | Status |
|---|---|---|---|---|
| Written reasoning memo | 0.54 | 0.33 | 25% | Retained, weight increased |
| System design interview | 0.49 | 0.28 | 25% | Retained |
| Work sample review | 0.47 | 0.26 | 25% | Retained |
| Code review exercise | 0.44 | 0.21 | 15% | Retained |
| Async collaboration signal | 0.38 | 0.17 | 10% | Retained |
| Timed algorithm puzzles | 0.31 | 0.04 | 0% | Removed March 2026 |
Table 1: Assessment components, predictive power and current weighting.
What we are still getting wrong
Two things bother us about this analysis and we would rather say them than have someone else find them.
First, manager ratings are a flawed criterion. They are unblinded, they correlate with likeability, and they are known to carry demographic bias. We use a composite that includes peer review and delivery consistency to dilute this, but we have not solved it. Second, we can only measure engineers we placed. The engineers we rejected might have done brilliantly, and we would never know. The classic range-restriction problem, which almost certainly means our true correlations are somewhat higher than reported and our confidence in the bar is somewhat lower than it looks.
Methodology and limitations
Cohort: all engineers placed through Engagetal between September 2025 and October 2025 who reached a six-month review by April 2026 with a complete assessment record (n = 412). Assessment scores were recorded before placement and were not visible to reviewing managers.
- Criterion measure. A standardised composite of manager rating (50%), structured peer review (30%) and delivery consistency from project records (20%), rescaled 0-100 within cohort and role family. Six months is a shorter follow-up than we would like; the company has not existed long enough for a twelve-month figure and we will publish one when it exists.
- Statistics. Pearson correlations for raw figures; partial correlations from OLS multiple regression with all six components entered simultaneously. Confidence intervals available in the full data appendix on request.
- Range restriction. We can only observe outcomes for engineers who cleared the bar, which attenuates the reported correlations. Corrected estimates using Thorndike Case II are 0.08 to 0.14 higher; we report the uncorrected figures as the conservative number.
- Known bias. Manager ratings are unblinded and carry documented demographic bias. We report aggregate results here; a separate audit of score and outcome distributions by gender and region is published annually and is available on request.
Want the underlying data?
We share anonymised datasets and full statistical appendices with researchers, journalists and customers on request. Write to us and tell us what you are trying to work out.
Related reports

The remote premium
Rate data from 640 engineers in 31 countries. The geographic discount is narrowing, and within-city spread already exceeds the gap between cities.
Read the report
The cost of a mis-hire
A wrong senior hire on a twelve-person team costs a median of $214,000. Salary is a minor line in that, and the biggest component is almost never measured.
Read the report
The async advantage
Delivery velocity peaks at three to four hours of daily overlap and falls after that. Writing things down is worth about four hours of timezone alignment.
Read the report