Take-home tests are failing everyone: completion, drop-off and signal quality
We analysed 4,180 take-home assignments. Nearly half were never submitted, the ones that were correlated weakly with performance, and the drop-off was heavily concentrated among candidates who could least afford the time.
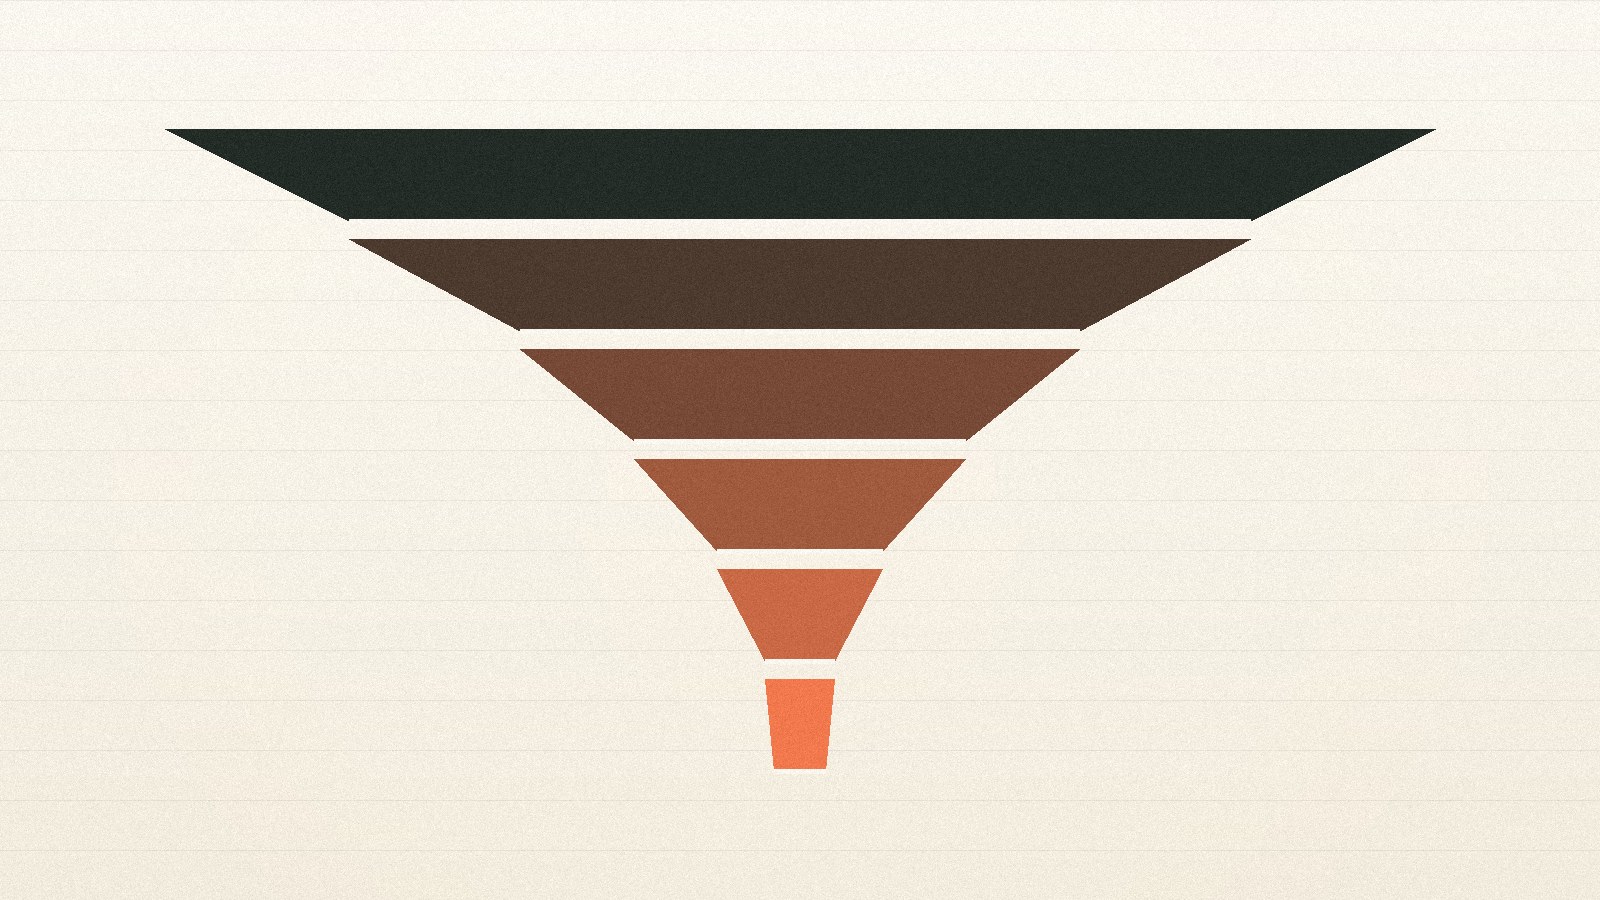
Candidate flow through a typical take-home stage. Each band shows the share of the original cohort remaining; the sharpest narrowing occurs before any work is evaluated.
What the data shows
- 46% of issued take-home assignments were never submitted. The single largest reason given was time, not difficulty.
- Completion fell sharply with stated time cost: assignments described as “about 4 hours” had a 71% completion rate; those described as “about 8 hours” had 38%. Actual median time spent exceeded the stated estimate in 84% of cases.
- Drop-off was 2.4x higher for candidates with caregiving responsibilities and 1.9x higher for candidates currently employed full-time. The stage filters for available time more efficiently than it filters for skill.
- Take-home scores correlated with six-month performance at r = 0.29, worse than a structured 90-minute pairing session (r = 0.44) that costs the candidate a fifth of the time.
- Paid take-homes had a 89% completion rate and drew a measurably broader candidate pool, at a median cost of $180 per completed assignment.
The take-home exercise was supposed to be the fair option. It removes whiteboard anxiety, it lets people work in their own environment, and it produces an artefact you can actually read. Every argument for it is reasonable.
We analysed 4,180 issued take-home assignments across 76 companies, tracking who accepted, who started, who submitted, and how the submissions eventually predicted performance on the job. The format is not delivering what it promises.
Nearly half never come back
Of assignments issued, 46% were never submitted. That is not a completion problem at the margins; it is the central fact about the format.
When we surveyed non-submitters, the most common reason by a wide margin was time, not difficulty, not offence at being asked, not another offer. They intended to do it, the week did not allow it, and by the time it did the process had moved on.
Figure 1 shows where people leave. Note that the sharpest narrowing happens between invitation and submission, which is to say before anyone has evaluated any work at all. Whatever this stage is filtering for, it is doing most of its filtering before the assessment begins.
Where candidates go
Share of the original invited cohort remaining at each point in a typical take-home stage.
The stated estimate is fiction
Completion rates track the stated time estimate almost linearly. A brief promising "about 4 hours" got 71% completion. A brief promising "about 8 hours" got 38%.
More damning: actual median time spent exceeded the stated estimate in 84% of assignments. A four-hour brief took a median of 6.4 hours. An eight-hour brief took 13.5. Candidates are consistently being asked for roughly 60% more time than they agreed to, and the ones who cannot absorb that overrun are the ones who quietly disappear.
We do not think this is dishonesty on the part of hiring teams. It is the standard planning error, made worse because the person writing the brief already knows the codebase and the intended solution.
Completion collapses as the ask grows
Submission rate against the time estimate stated in the assignment brief.
Whatever this stage is filtering for, it is doing most of its filtering before the assessment begins.
Section 1: Nearly half never come back
Who gets filtered out
This is the part of the analysis that changed our own practice. Drop-off was 2.4 times higher among candidates who reported caregiving responsibilities and 1.9 times higher among candidates currently employed full-time.
Both groups are, on average, no less capable. They have less discretionary evening time. A stage that demands six to thirteen unpaid hours in a week selects powerfully for people with spare capacity, which correlates with being early-career, unattached, unemployed, or supported by someone else.
The format that was adopted to make hiring fairer turns out to have a sharply regressive filter built into it. It is just an invisible one, because the people it excludes never appear in your candidate data. They are a gap in the funnel, not a rejection you can review.
Signal per hour of candidate time
Correlation with six-month performance against hours demanded from the candidate.
And the signal is mediocre
If take-homes bought exceptional predictive power, there would be a real trade-off to argue about. They do not. Take-home scores correlated with six-month performance at r = 0.29 in our matched subsample.
A structured 90-minute pairing session on a realistic problem hit r = 0.44 while asking for a quarter of the time. A written design memo, roughly an hour, hit 0.38. Figure 3 plots signal against candidate time cost, and the take-home sits in the worst quadrant: expensive and mediocre.
Our reading of why is that a take-home measures the artefact and not the process. You see the final commit, not the reasoning, the dead ends, or how the person responded to a constraint changing halfway through. Those are the things that predict senior performance, and they are exactly what a pairing session surfaces.
If you are going to run one, pay for it
Paid take-homes in our sample had an 89% completion rate against 54% unpaid, at a median cost of $180 per completed assignment. The candidate pool that completed them was measurably broader on every dimension we could measure.
Against the mis-hire cost modelled in ER-2026-05, $180 is not a real number. If a take-home is genuinely the right instrument for your role (and for some, such as long-horizon architectural work, it may be) pay for the time and shorten it to three hours. If you cannot justify paying for it, that is useful information about how much you actually valued the signal.
Methodology and limitations
Sample: 4,180 take-home assignments issued by 76 companies between September 2025 and March 2026, tracked from invitation through to submission or lapse. Performance correlations use a matched subsample of 540 hires where more than one assessment format was recorded.
- Non-submission window. An assignment counts as non-submitted after 14 days with at least two reminders. Extensions granted on request are excluded from the lapse count.
- Time spent. Self-reported at submission and therefore subject to recall error in both directions. Where automated tooling telemetry was available (n = 770), self-report understated actual time by a median of 11%.
- Demographic drop-off. Caregiving status and employment status were self-reported at application and voluntary; 63% of candidates provided both. Differential drop-off is computed only within the responding subset, which may itself be non-representative.
- Limitations. Non-submitters cannot be assessed, so we cannot know how capable they were. The drop-off analysis shows who leaves, not what was lost. Comparisons between formats are observational; companies choosing pairing sessions differ from those choosing take-homes in ways we can only partly control for.
Want the underlying data?
We share anonymised datasets and full statistical appendices with researchers, journalists and customers on request. Write to us and tell us what you are trying to work out.
Related reports
The async advantage
Delivery velocity peaks at three to four hours of daily overlap and falls after that. Writing things down is worth about four hours of timezone alignment.
Read the report
The 48-hour match
The median engineering role takes 41 working days to fill. Only 6.5 of them involve assessing anyone. We instrumented 287 hires to find out where the rest goes.
Read the report
AI-native engineers
Heavy adopters of LLM tooling spend half as much of the week writing first-draft code, and nearly twice as much reviewing it. The job changed shape more than it changed size.
Read the report