AI-native engineers: how LLM tooling changed the shape of a senior developer
We compared 386 engineers by how heavily they lean on LLM tooling. Output went up with adoption. The distribution of what senior engineers spend their time on changed more than the volume did.

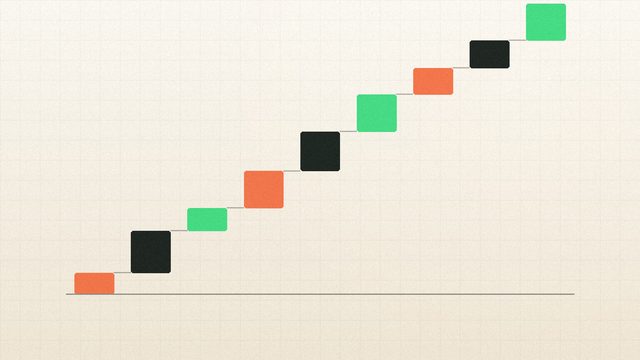
Task-time distribution for senior engineers at low and high levels of LLM tool adoption. Node size represents share of working hours; edges represent common task transitions within a working day.
What the data shows
- Among heavy adopters, time spent writing first-draft code was 19% of the week against 38% for light adopters. Time spent on review, verification and specification ran 41% against 24%.
- Heavy adopters merged 31% more by reviewed complexity, but carried 18% higher defect density. Netting out rework, the real gap is closer to 19%.
- Engineers who scored highly on written reasoning captured 2.6x more benefit from the tooling than those who did not. The tools amplify specification skill; they do not substitute for it.
- The strongest predictor of effective AI use was maintaining an evaluation harness. Engineers with one shipped 44% fewer regressions than equally productive peers without one.
- Junior engineers showed the largest raw output gain and the largest quality regression. The tools compress the output gap and widen the judgement gap.
The question we hear most often from engineering leaders is some version of: are these tools actually making my team faster, or does it just feel that way? It is a fair question and it has a slightly uncomfortable answer.
We had an unusual position from which to look. Because we assess engineers on standardised work samples, we can compare people who lean heavily on LLM tooling against people who barely touch it, holding assessed ability roughly constant. That is not the same as a before-and-after study, and we say so plainly in the methodology, but it removes the biggest confound in most published claims: that heavy tool users might simply be better engineers.
The job changed shape more than it changed size
Figure 1 is the finding we did not expect to be so clean. Among the heaviest quartile of tool adopters, time spent writing first-draft code was roughly half what it was for the lightest quartile: 19% of the week against 38%.
That time did not turn into free time. It turned into review, verification and specification, which together ran 57% for heavy adopters against 35% for light ones.
A senior engineer working this way spends most of the week reading: reading generated code, reading diffs, reading specifications they are about to hand to a machine, and reading the output to work out whether it is quietly wrong. The craft shifts from production to adjudication.
This has a practical consequence that we think is under-appreciated in hiring. If more than half of the role is now judgement about code rather than production of code, then an interview process built almost entirely around producing code under time pressure is measuring a shrinking part of the job.
What a senior engineer week is made of
Share of working hours by activity, comparing the lightest and heaviest quartiles of LLM tool adoption.
The productivity gain is real but smaller than the headline
Heavy adopters merged 31% more than light adopters, weighted by reviewed complexity. That number is genuine and it is also the least useful number in this report.
The same group carried 18% higher post-merge defect density. When we net out rework, the output that existed only to fix output, the underlying gap falls to about 19%. Still substantial. Not 31%.
Figure 2 tracks the same measures across our three full quarters of observation. Output climbed, defect density climbed with it, and the gap between gross and net output widened. Our reading is that teams take an initial quality hit and then build the guard rails. We do not yet have enough quarters to show the recovery, and we are not going to claim one we cannot see.
Output and defects moved together
Indexed to 100 at our earliest full quarter of observation. Merged output against post-merge defect density.
When generation is cheap and verification is expensive, verification is the discipline.
Section 4 on what separates good AI use from bad
The gains are not evenly distributed
Figure 3 is the chart with the most direct implication for anyone deciding who to hire. We split engineers by their written-reasoning score at assessment, a measure taken before they had any relationship with us, and looked at how much the heavy adopters in each band pulled ahead of the light ones.
In the top written-reasoning quartile the gap was 31 points. In the bottom quartile it was 12. The tools reward the ability to state a problem precisely, because that is essentially the whole interface. An engineer who can write a clear specification gets a useful draft back; an engineer who cannot gets a confident, plausible, subtly wrong one and often does not notice.
The junior finding is the one that worries us. Junior engineers showed the largest raw output gain of any group and also the largest quality regression. They can now produce work that looks senior and is not, which makes it considerably harder to tell, from the artefact alone, whether someone actually understands what they shipped. Every part of hiring that relied on reading a candidate code as a proxy for their judgement has become less reliable.
The tools amplify what is already there
Productivity gap between heavy and light adopters, split by the engineer written-reasoning score at assessment.
What separates good AI use from bad
The single strongest behavioural predictor in our data was unglamorous: whether the engineer maintained an evaluation harness. Engineers who wrote tests, evals or verification tooling before generating the implementation shipped 44% fewer regressions than equally productive peers who did not.
This is not a new engineering principle. It is the oldest one, restated for a context where the cost of producing plausible code has fallen to nearly zero and the cost of verifying it has not fallen at all. When generation is cheap and verification is expensive, verification is the discipline.
Methodology and limitations
Cohort: 386 engineers with standardised work-sample records and at least one full quarter of observed delivery data between October 2025 and June 2026, including 118 senior engineers who consented to detailed activity telemetry.
- This is a cross-sectional comparison, not a before-and-after study. Engagetal has only existed since August 2025, so we cannot observe the same engineers across the adoption transition. We compare heavy against light adopters at the same point in time, holding assessed ability constant, which is a weaker design and we would rather say so than imply otherwise.
- Adoption measure. Measured tool invocations per working hour from consented telemetry, banded into quartiles. Self-reported adoption correlated with measured adoption at only r = 0.51, which is why we do not use it.
- Output measure. Merged pull requests weighted by reviewed complexity, not raw line count. Line-count metrics are trivially inflated by generated code and we consider them useless for this question.
- Defect attribution. Post-merge issues linked to a specific change within 90 days by the owning team, normalised per unit of output.
- Limitations. Self-selection into heavy tool use is almost certainly correlated with traits we cannot fully control for, and matching on assessed ability only partly addresses it. Engineers who volunteered telemetry may differ from those who did not. Three quarters is a short series.
Want the underlying data?
We share anonymised datasets and full statistical appendices with researchers, journalists and customers on request. Write to us and tell us what you are trying to work out.
Related reports
The cost of a mis-hire
A wrong senior hire on a twelve-person team costs a median of $214,000. Salary is a minor line in that, and the biggest component is almost never measured.
Read the report
Take-home tests are failing everyone
Nearly half of all take-home assignments are never submitted, and the drop-off falls hardest on candidates with the least spare time. The signal does not justify the cost.
Read the report
The 48-hour match
The median engineering role takes 41 working days to fill. Only 6.5 of them involve assessing anyone. We instrumented 287 hires to find out where the rest goes.
Read the report